

Shanghai is a city of nearly 25 million people, and they
have been in an iron-clad lockdown now for almost six weeks now. This is not a stay-at-home
order like we experienced in the United States, where guidelines have been
loosening—wearing a mask on an airplane has even become optional for us. Alternatively,
in Shanghai, the government has implemented measures such as installing
electronic door alarms on the homes of those who have tested positive for COVID-19,
forcibly removing people from their homes while leaving their pets behind and leaving
the doors to their homes open to permit industrial-style sanitation. They have
bussed people who have tested negative more than 100 miles from their
homes, just because they had close contact with a positive case. Freshly built chain
link fences are suddenly popping up around people's houses and apartments, locking
residents in. They are disinfecting the street surfaces with lime! How many
people are contracting COVID-19 by walking on the streets? The lime they are
using to "cleanse" all the outdoor areas is extremely alkaline and will likely
mess up local waterways for years to come. The local authorities have been told
to stop the spread at all costs, and that is what they are trying to do.
Some in the locked-down areas of the city are struggling to
get food and medical supplies. There are heart-wrenching videos of citizens
yelling out at night, begging for anyone who might have fever medication for
their family members. Commonplace surgeries and lifesaving medical services are
not available. Out of the 25 million people in Shanghai, only about 87 people
have died due directly to COVID-19. Somewhere around 4,000 have had symptoms
(most of them from the elderly population, according to Bloomberg. Think about that
number for a minute: out of 25 million people, 0.00034% have died. Most cases
are asymptomatic. This is all due to the Omicron BA-2 strain which is easily transmissible.
Scientists generally believe it to be more transmissible than the measles, the
common cold, and even the flu. Thankfully, it is not nearly as virulent as
earlier COVID-19 strains.
All of this is happening because the Chinese government has
issued a zero COVID-19 policy. Unfortunately, just this week, some cases have
now been popping up in Beijing, and the markets and others fear that the
dystopian policies in force in Shanghai might soon be enacted in Beijing. The
local population is already waiting in long lines to buy as many groceries and
supplies as they can get their hands on, while they still can.

The reality is that the Omicron BA.2 variant, according to
the research I have been able to do, is not stoppable. You can put as many
people in the streets with hazmat suits as you like, lime-dust as many streets and
"disinfect" as many buildings as you want, but you will not be able to stop it.
Nonetheless, Beijing is preparing to institute similar
measures. They have had a total of 70 cases since last Friday and are now
planning to test every single person in Beijing three times each over the next ten
days. That is something like 80 million tests, a staggering number.
So, what in the world can this all have to do with bonds and
investing?
It is connected in that in both the Chinese zero COVID-19 policy,
and many investment approaches, spurious and misleading statistics are leaned
upon in an attempt to perfectly measure risk. Those in investing might fail
almost as miserably as the Chinese government has. I want to look at three of
the most obvious and often misleading statistics but will reserve the right to highlight
more in a future post. Let's start with the big three:
Yield, Duration, and Average Life
Let's start with the granddaddy of all single-statistic
parameters: yield.
I think it is helpful to go back to the origins of the term
yield, which comes from farming. According to the Merriam-Webster dictionary,
when yield is used as a verb it means to produce or provide. In the financial
context, it has become a shortcut for how much income I should/might receive
from an investment. When you start digging into the way that Bloomberg and
other financial calculators try to measure this value, the waters start to get
really muddy really fast. From Bloomberg, the following caveat is in their
definition:
"While there are a lot of
variations for calculating the different kinds of yields, a lot of liberty is
enjoyed by the companies, issuers and fund managers to calculate, report and
advertise the yield value as per their own conventions"
Furthermore, Bloomberg suggests the entire calculation of yield
as null and void once you start looking at floating coupons derived from an
index, since we cannot know the future levels of the index. They should offer
a similar caveat for any security with unknown future cashflows.
Is it really that complicated? The street would love for us
to believe that it is simple. It helps to sell securities and is used as a
talking point in almost every single sale of a fixed income security. In the
most common presentation of a mortgage backed (or asset backed) security, yield
is actually calculated out to the fourth decimal place. The interesting thing
that anyone familiar with the math would confirm is that this calculation is
almost certainly wrong from the outset. Wrong. Dead wrong. Known to be wrong in
the sense that it is almost certainly never going to play out to that fourth
decimal—or even to the first—in reality.
Here's the catch. We cannot even make the yield calculation
work if we do not know the exact cashflow and re-investment rate of every
single payment. In the case of a simple 15-year mortgage pool, that means we
would need correctly predict exactly what the payment stream is for every
single future month - 180 months in a row. It's just not possible.
If you think I am overstating this, do a little research of
your own. What you will find is that any serious discussion of yield on a
security (or loan!) in which the future cashflows are not certain is a very
vague and almost meaningless discussion. And yet we all engage in it.
Duration
If possible, the use of duration as an investing
tool/measuring stick can be even more pernicious and potentially
misleading than the use of yield.
Why is it such a troublesome statistic, you may ask? I think
mostly because it is so misunderstood. In our common vernacular, the term
duration almost always means measurement of time. For example: "What is the
duration of the musical recital?" or, "The duration of the flight is around six
hours." If you go to the dictionary, you will find that duration is defined as
a time during which something occurs. In my experience teaching about fixed
income across the country for the past 25 years, that is what most investors
think duration is supposed to mean in the world of investing…and this is incorrect.
Duration and its derivatives (Effective, Modified and Macauley) in the
financial markets were designed to attempt to measure the sensitivity of the
price of a bond to an immediate change in an interest rate.
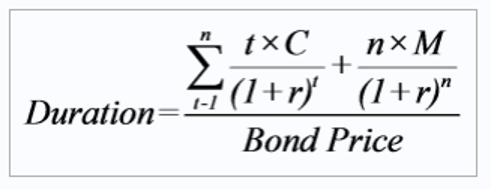
As you can see, it is a complex formula, and beyond the
scope of this little post, but there has been a tremendous amount of serious
thought on the topic. It makes sense, because we would all love to know the
price sensitivity of our portfolios to given changes in rates. Unfortunately,
most serious students of this topic acknowledge that we cannot know the future
cashflows of most securities, and even less of portfolios of securities, nor
can we know the yield curve's shape in the future, or the path rates will take
to get there. Can we approximate? Sure. Will it be correct? Probably not, and
if so, it will most likely be by coincidence.
However, this brings me back to my opening thought on how
deadly this statistic can be. Many investors will compare two or more
securities with approximately the same duration but with dramatically different
types of cashflow volatility as though it is apples to apples. But the
differences not apparent in the duration value render the calculations
irrelevant and inaccurate.
Average Life
Of the three statistics we are examining today, average life
is probably the simplest. Maybe that is why it is so often used incorrectly.
The simple physical analogy for average life is a teeter-totter (in some parts
of the country, you may call it a seesaw). When we think of teeter-totter, we
know that there is a balancing point somewhere in the middle.

Your physics professor in college referred to this as a
fulcrum. We can calculate where this
point will be using simple math. There is no need to use the present value
equation and there are no derivatives. All we need is to figure out the weights
and positions of the objects on the beam and we can find a balancing point. But
we do need accurate weights and positions.
If we can consider a pool of 15-year mortgages and think of
the principal payments as the weights, and the timing of these payments as the
positions, we can come up with a picture and process for finding this
equilibrium point and call it average life. Depending on the level of interest
rates, this number will vary, but for simplicity's sake let's call the typical
result somewhere around five years. Each month, homeowners will make a payment
on their house which is partially principal and partially interest. The
breakdown of these payments changes every month. Some people will prepay,
refinance, or change their payments based on personal situations. These changes
are unknowable to us in advance, as investors.
This is where the problem starts. As I mentioned above, the
expected average life might be five years, and so the broker-dealer community
will seize on that statistic and compare it to other five-year assets, such as
a 5-year Treasury. When they throw in the granddaddy of stats (yield) and
compare them they will almost always find that the mortgage pool's calculated
yield is higher than that of a Treasury. It will also have a lower duration.
You honestly could not find two more dissimilar securities.
The comparison makes no sense whatsoever, but it is used every single day in
the capital markets. The pool of mortgages has 180 principal payments, which
change every month, and the Treasury has only one principal payment, five years
hence.
The three statistics discussed above drive billions of dollars'
worth of fixed income decisions and they are wildly misunderstood and misused.
As a portfolio manager, developing an understanding of these widely unnoticed flaws
gives you a great advantage.
Just as the Chinese government cannot stop Omicron BA.2 by
throwing lime powder on the sidewalks and putting all their citizens under
house arrest, we cannot collectively stop the use of these statistics, but we
can understand how they are misused and deploy this knowledge to our advantage.
One thing I know for sure: single statistic parameters that do not incorporate
dynamic cashflow and interest rate scenario analysis are virtually useless.
Remember - I don't know what the future will bring, and
neither do you. Evaluate a broad, meaningful set of scenarios, and do not rely
on what the "street" gives you as being useful.
Final, final thought: I'm on a bit of an Indian food
kick…but I need some new recipes. Please send them my way!
Fill out the form below to subscribe to my weekly blog.
The information, analysis, guidance, and opinions expressed herein are for general and educational purposes only and are not intended to constitute legal, tax, securities, or investment advice or a recommended course of action in any given situation. Information obtained from third-party resources are believed to be reliable but not guaranteed. All opinions and views constitute our judgments as of the date of writing and are subject to change at any time without notice. Past performance does not guarantee future results